|
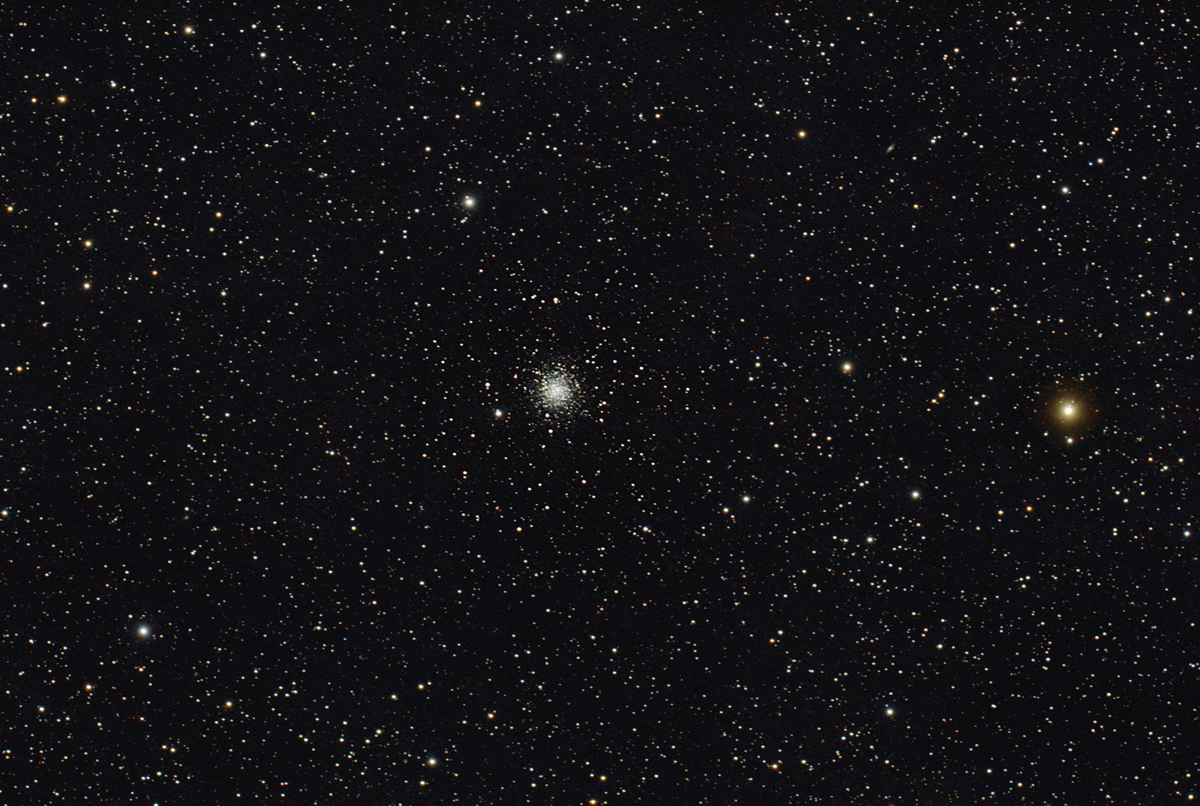
Ammasso globulare M72 in
Acquario (NGC 6981) Globular clusters M72 in Aquarius (NGC 6981) A.R. 20h53m30s - Decl. -12°32'00" |
|
Questa foto dell'ammasso globulare M72 in Acquario è stata
scattata nei giorni
16 e 17 agosto 2010 dal giardino di casa ad Arcidosso (GR) al
fuoco diretto di un telescopio Takahashi TSA 102 ridotto
a f/6.3 su montatura
Gemini G41 Obs. L'esposizione è la somma di 25 frames da 10 minuti ciascuno ripresi con la Canon EOS 40D settata a 800 ISO e modificata con Filtro Baader IR-Cut, ed è stata effettuata con autoguida Atik 16IC e rifrattore 120/600 in parallelo. La temperatura esterna era fra i 12.5° e i 13.5° C ma con un prototipo di cold box da me realizzato ho operato a temperature di circa 8° più basse costantemente. Successivamente i frames sono stati allineati calibrati con Deep Sky Stacker mediante l'uso di 25 dark, 21 flat, 21 dark dei flat e 21 bias, poi allineati e sommati con Registar, processati mediante applicazione di stretching, maschera sfocata, bilanciamento dei colori, riduzione del rumore. Nella tabella sottostante sono riportati i valori di temperatura, umidità e brillanza del cielo nella zona ripresa (usando lo SQM-L) a vari orari. This photo of the globular clusters M72 in Acquario, was taken on august 16 and 17, 2010 from the backyard of my home in Arcidosso, in Italy, near Grosseto, at the prime focus of a Takahashi TSA102 telescope reduced at f/6.3 using a Gemini G41 Obs mount. The photo is the sum of 25 frames of 10 minutes, taken using a Canon Eos 40D Digital camera, modified with a Baader IR-Cut filter, at 400 ISO and they were taken with an Atik 16IC autoguide on a small refractor 120/600. The air temperature was about 54,5/56°F but. using a self made cold box my dslr worked at about 14°F less. About processing. I calibrated the frames with Deep Sky Stacker using 25 darks, 21 flats, 21 darks of flat, 21 bias. Then I stacked and summed the resulting frames with Registar, and processed the resulting file with stretching, unsharp mask, color balance, noise reduction. In the table below I put the value of temperature, humidity and brillance of the sky in the zone of the clusters (using a SQM-L) taken in different time. |
| DATA | ORA/TIME (U.T.) | Temperatura dell'aria (Celsius) | Temperatura della cold box (Celsius) | Umidità | SQM |
| 16/08/2010 | 21:25 | 13.1° | 4.8° | 97% | 20.68 |
| 16/08/2010 | 22:15 | 12.5° | 4.5° | 98% | 20.83 |
| 16/08/2010 | 22:50 | 12.6° | 4.6° | 98% | 20.91 |
| 16/08/2010 | 23:25 | 12.9° | 4.2° | 98% | 20.85 |
| 16/08/2010 | 23:55 | 12.7° | 3.5° | 94% | 20.85 |
| 17/08/2010 | 00:35 | 12.5° | 3.7° | 96% | 20.81 |
| 17/08/2010 | 22:05 | 13.4° | 5.4° | 99% | 20.69 |
| 17/08/2010 | 23:00 | 13.4° | 5.2° | 99% | 20.88 |
| 17/08/2010 | 23:40 | 12.9° | 4.3° | 99% | 20.71 |